R and Excel
Microsoft Excel is used for for simple analysis and presenting data. The program is almost ubiquitous and allows easy transfer of data.
For complex and repeatable data analysis, we use R. This program allows deep analysis of data, but doesn’t offer the user friendly, graphical user interface of Excel.
R excels in three areas:
- Extracting insights from data. R offers a wide range of analytical tools, including fundamental analysis, statistical and machine learning .
- Automated, repeatable analysis. Through scripts data can be automatically ingested, analysed and shared. If data needs to be gathered regularly from multiple sources, an R script can cut down manual interventions and remove errors.
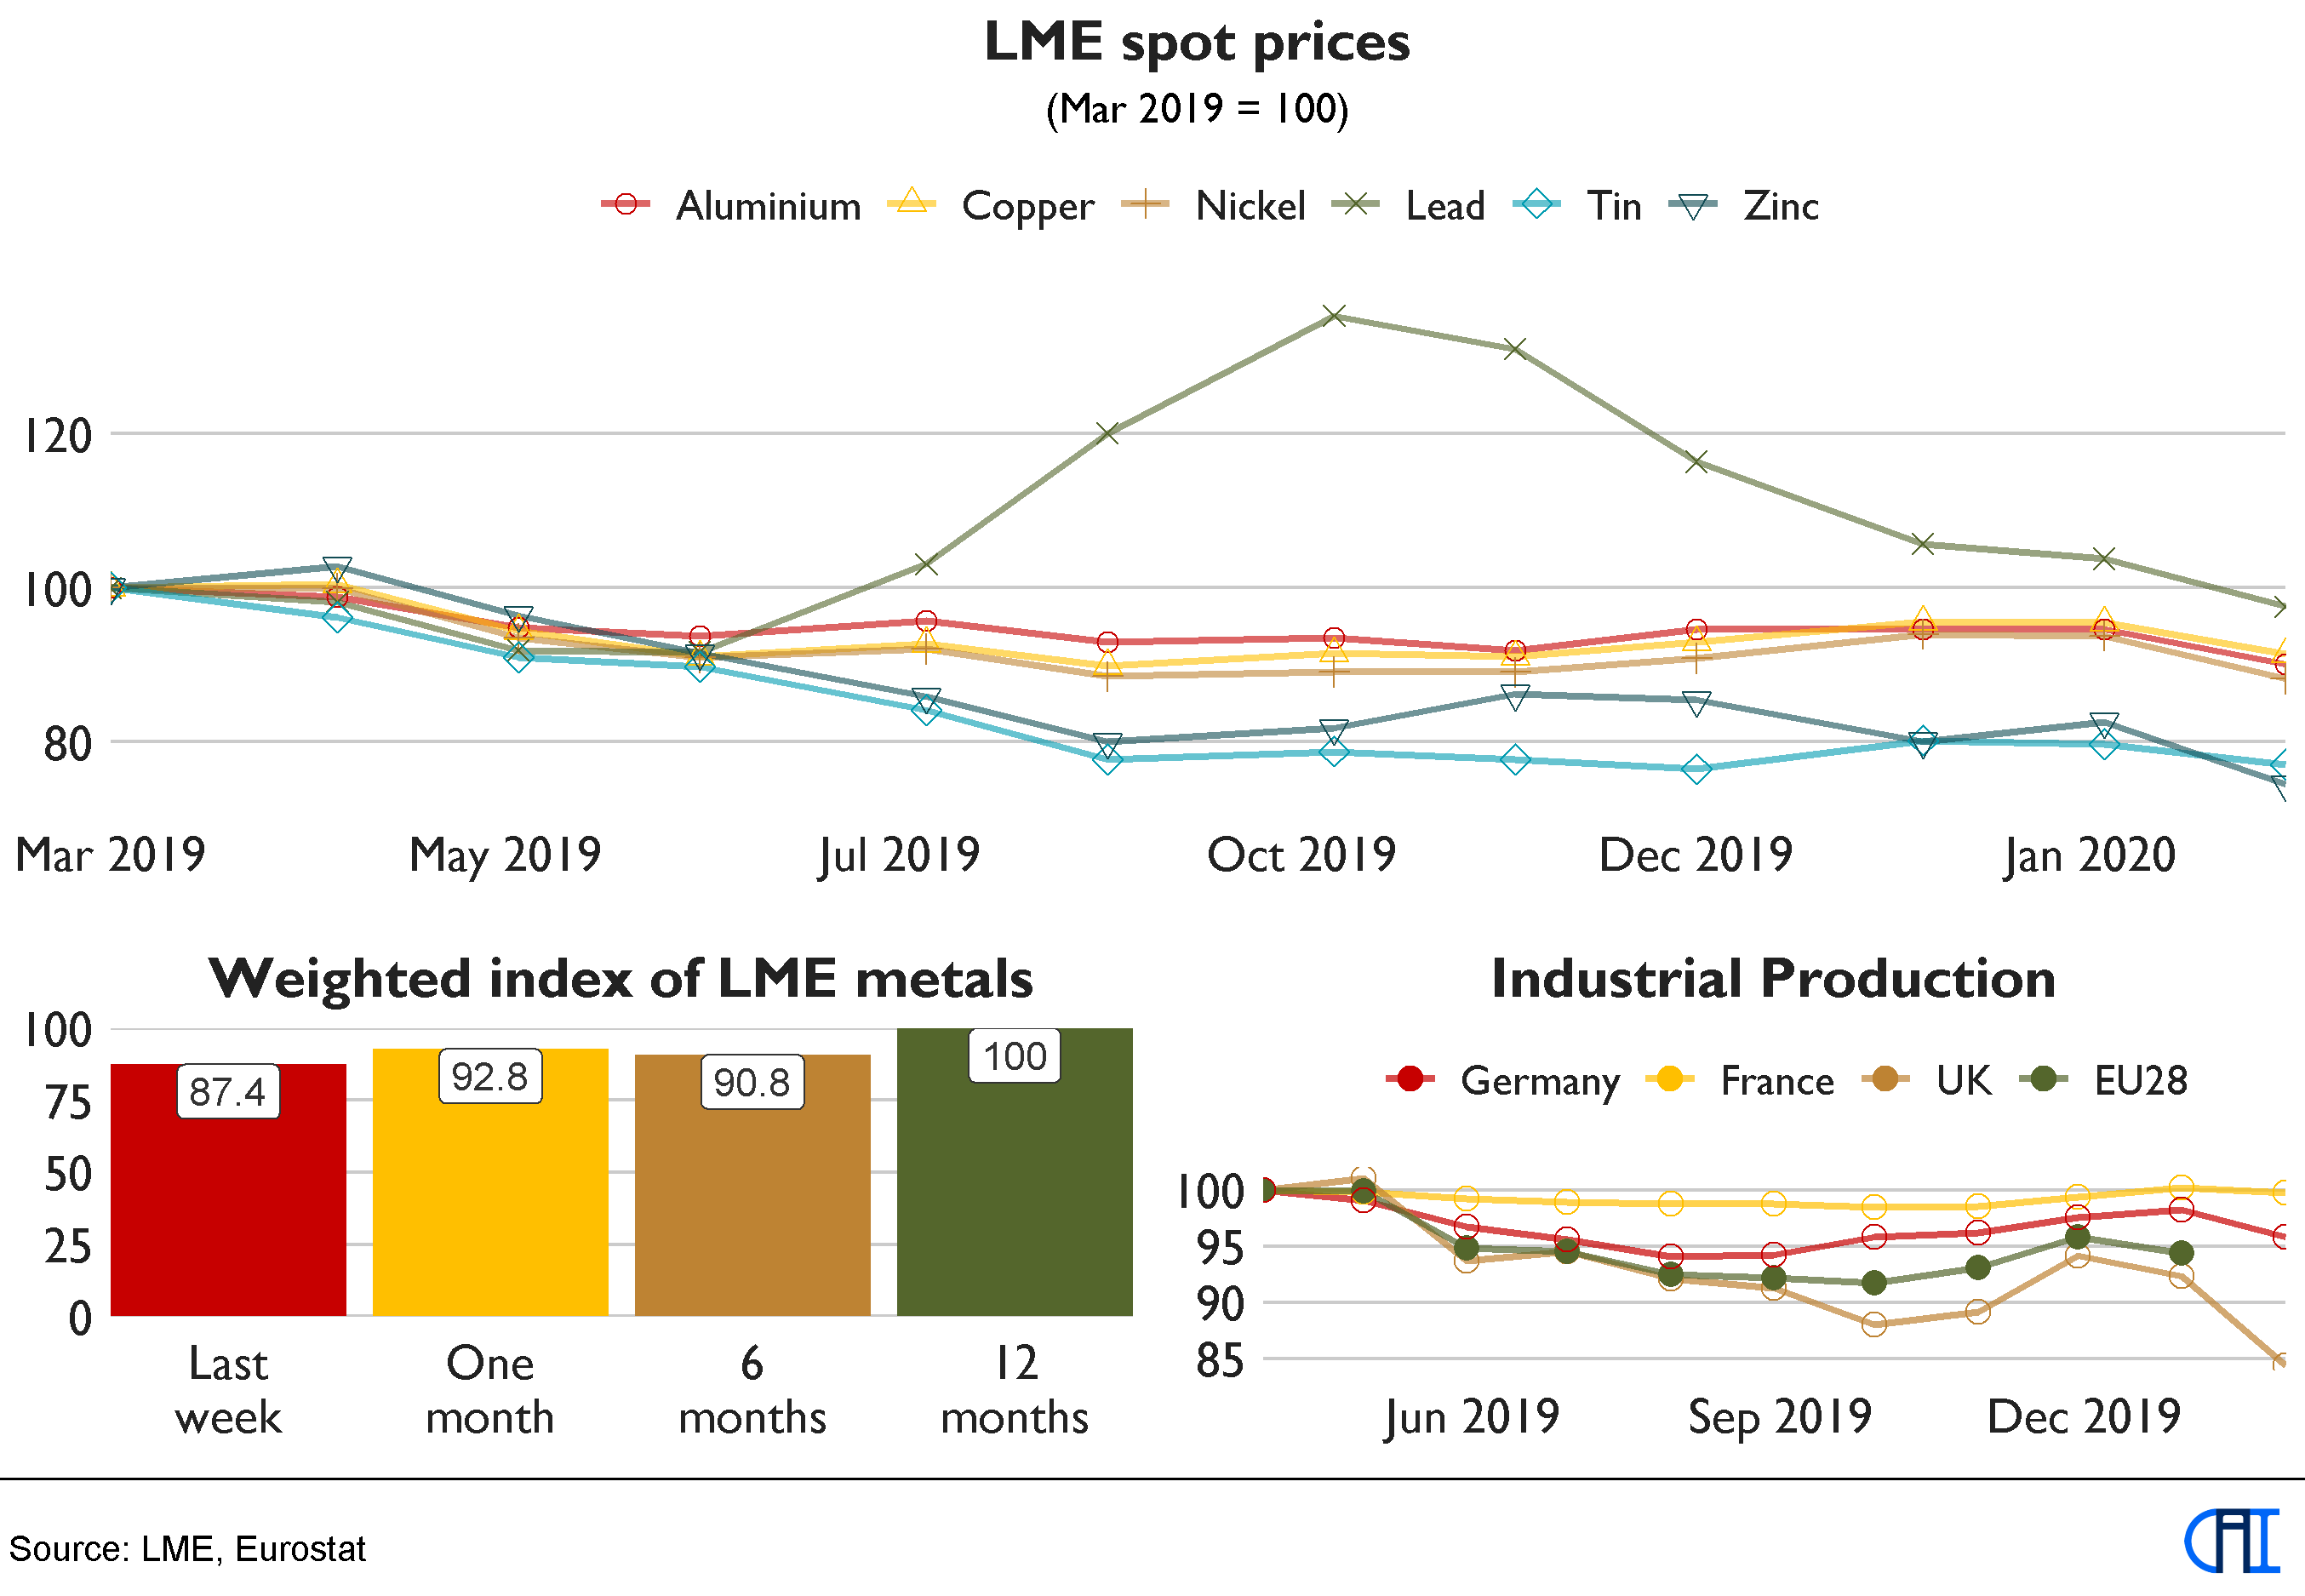
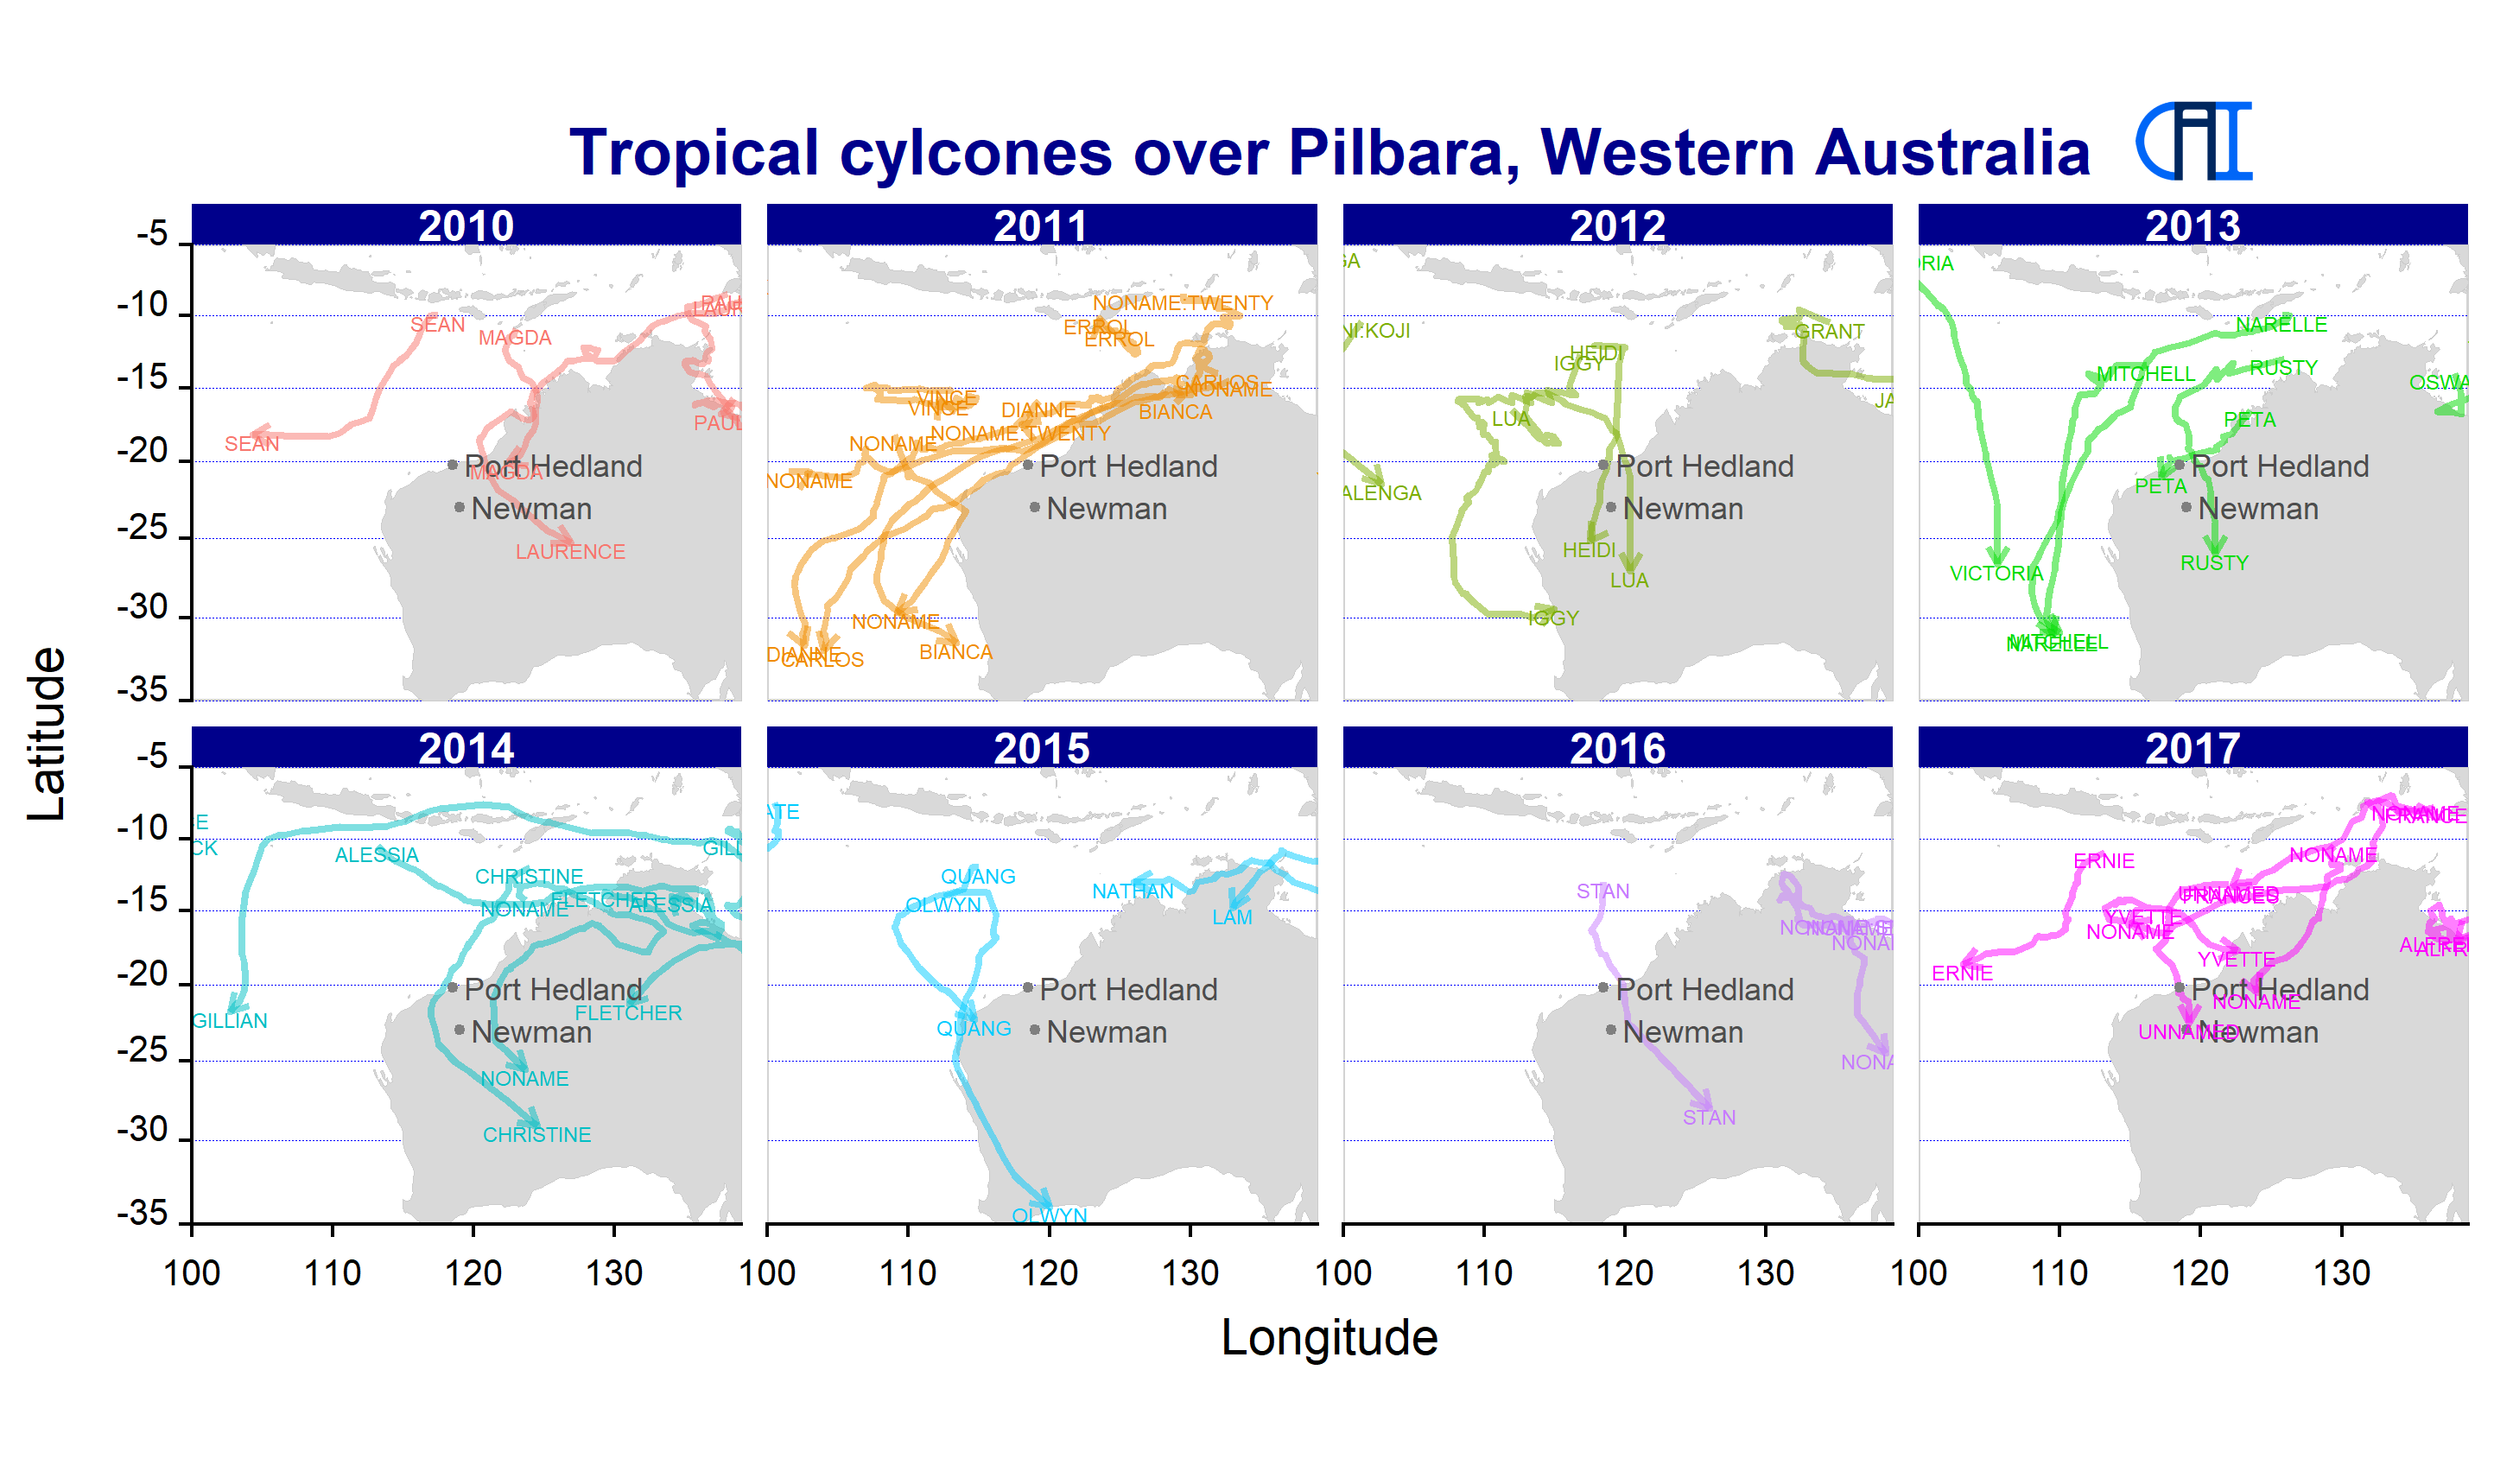
- Graphical representation of the data. The graphing capabilities of R are far superior to Excel. This allows the data to be presented to show take-away. Examples include:
LME data dashboard